WellCAD 6.0
September 2025
Highlights
We are excited to release WellCAD v6.0, a major update featuring a brand-new geomechanics module, along with powerful enhancements designed to streamline your workflows and enhance your overall experience.
WellCAD v6.0 introduces a major expansion with the launch of the new Geomechanics Module, marking ALT’s entry into the geomechanics domain. The release also includes enhancements across core modules, improved stability and numerous bug fixes for a smoother user experience.
- Geomechanics: Rock Mechanics Calculations
- Geomechanics: Stress Calculations
- Geomechanics: Fracture Stability (Mohr-Coulomb Circles)
- Box Plots
- Spider Plots
- Script Console for automation processes
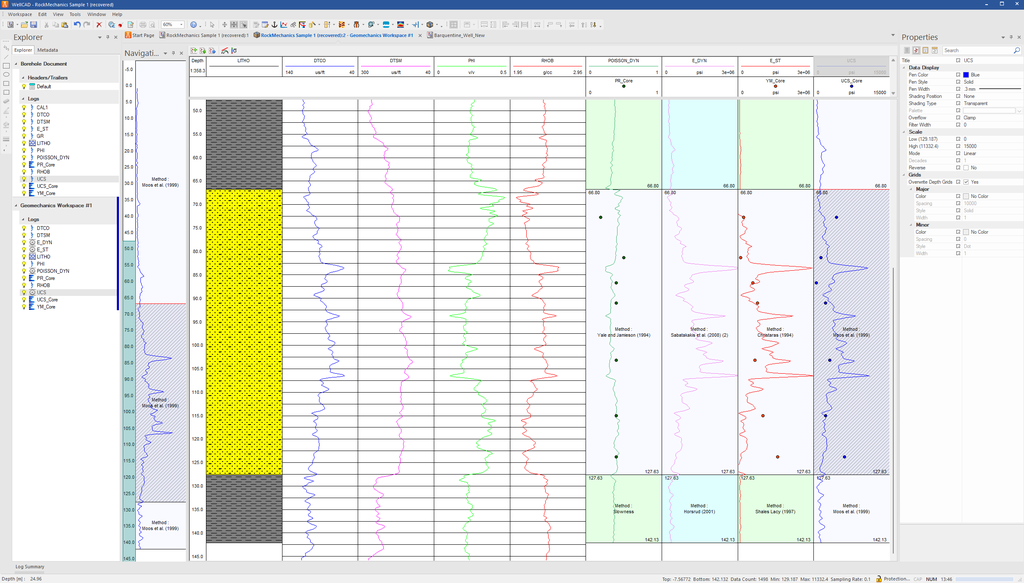
New WellCAD Geomechanics
WellCAD v6.0 introduces a new Geomechanics Workspace designed for subsurface engineers, geomechanists and geoscientists to accelerate rock mechanics analysis, stress modelling and fracture stability workflows.
The new Geomechanics Workspace streamlines complex workflows by automating key calculations, reducing manual effort, and enabling teams to focus more on interpretation and decision-making, ultimately improving efficiency and analytical depth. By addressing geomechanical risks early, it helps de-risk operations, avoiding costly delays and safety issues before they escalate. The outcome is greater productivity, safer projects, and faster delivery of results.
The new Geomechanics Workspace is an integrated add-on module that connects seamlessly with the wider WellCAD platform, allowing users to perform geomechanical analyses within the same environment. This tight integration enables smooth data flow, reduces duplication of effort, and ensures that geomechanics outputs can be directly incorporated into larger, multidisciplinary workflows, supporting more efficient and cohesive project delivery.
The new Geomechanics Workspace seamlessly integrates with other WellCAD modules such as FWS, where valuable geomechanical inputs like P- and S-slowness can be derived, and ISI (Image and Structure Interpretation), where fracture picks and structural features can be interpreted and directly leveraged for advanced geomechanical analysis within a unified workflow.
The new Geomechanics functionality in WellCAD offers a comprehensive set of tools to carry out the most common geomechanical workflows with ease and flexibility.
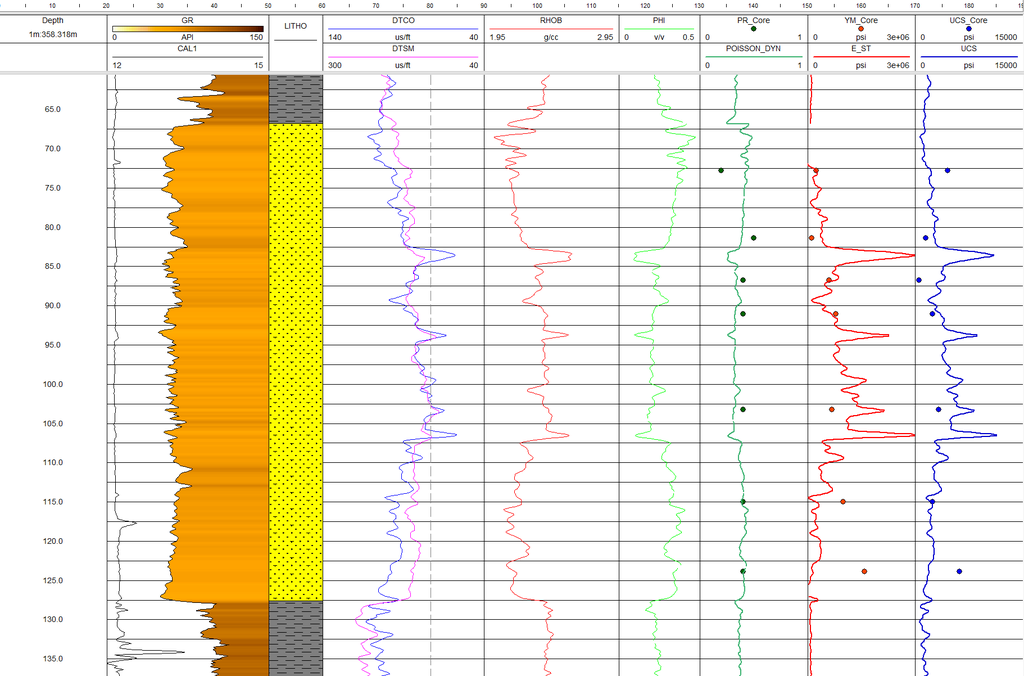
Rock Mechanics
The new Geomechanics Workspace is a comprehensive module designed to streamline and centralize the calculation of key rock mechanical properties critical for geomechanical modelling. Emphasizing scientific rigor and practical application, the workspace includes functionalities for computing:
- Poisson’s Ratio
- Young’s Modulus (Dynamic and Static)
- Unconfined Compressive Strength (UCS)
- Shear Modulus
- Bulk Modulus
- Tensile Strength
- Friction Angle
- Cohesive Strength
A standout feature of this module is its extensive reference library, which compiles the most academically and industrially recognised methodologies for property estimation. These are organized by lithology type, enabling users to quickly identify and apply the most appropriate calculation approach based on rock type.
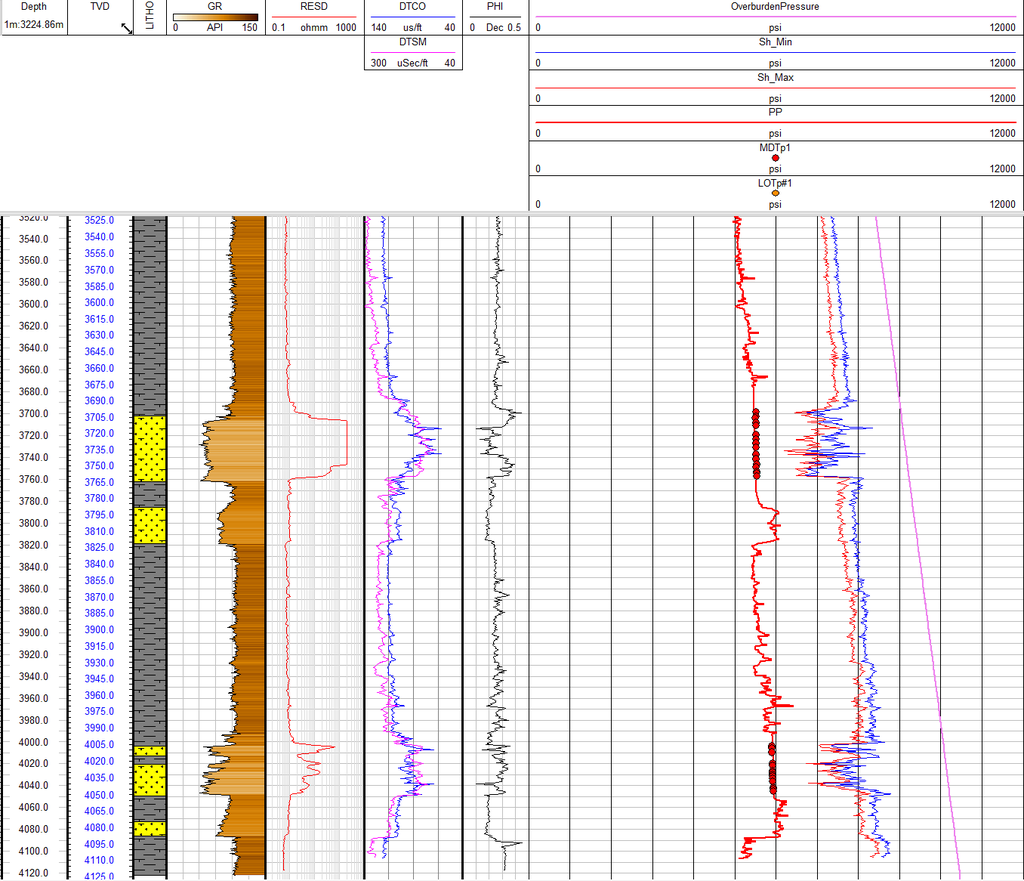
Stress Calculations
The Stress Calculation Module is an integral part of the Geomechanics Workspace, designed to facilitate the estimation of in-situ stress conditions essential for wellbore stability, fault reactivation, and fracture design studies. This module enables the calculation of the following components:
- Hydrostatic Pressure
- Vertical Stress
- Pore Pressure
- Minimum Horizontal Stress
- Maximum Horizontal Stress
To support accurate stress estimation, the module is complemented with a dedicated workflow for the derivation and quality control of key input parameters, including:
- Formation Density
- Compressional Slowness (P-wave)
- Shear Slowness (S-wave)
Overall, the Geomechanics Workspace offers a robust and efficient environment for constructing stress models, with methodologies aligned to both industry best practices and academic standards.
Fracture Stability
The Fracture Stability section of the Geomechanics Workspace offers an interactive environment for assessing fault and fracture reactivation potential using Mohr-Coulomb failure criteria. This module features:
Mohr-Coulomb Circle Visualisation
Dynamic cross-plots display stress states as Mohr circles, allowing efficient evaluation of fracture stability.
Integrated Logplot View
Users can correlate stress behavior with well log responses, enhancing interpretation accuracy.
Fracture Overlay
Previously interpreted fractures from the Image and Structure Interpretation (ISI) module are automatically overlaid on the Mohr diagram, enabling direct assessment of fracture slip tendency under current stress conditions.
Interactive Platform
The Geomechanics Workspace is designed as an integrated, interactive environment that centralizes all key geomechanical calculations and data visualisation in one place. It provides a structured, modular platform that enables users to seamlessly switch between tasks, compare results and manage complex workflows efficiently. This integrated approach enhances productivity, reduces time and supports methodological consistency.
The intuitive interface supports both standard and advanced use cases, making it suitable for a broad range of users. Key functionalities highlighted in the Geomechanics Workspace are:
Zonation Support
Users can define multiple geological zones, each with its own set of input parameters and calculation methods. This allows for a tailored geomechanical model where different estimation techniques can be applied across stratigraphic intervals and seamlessly integrated into a unified output.
Custom Equation Editor
The workspace includes a powerful equation editor that allows creation, storage, and execution of customized formulas and methodologies. These user-defined equations can be integrated alongside default methods and selected at will, providing a high level of flexibility for expert geomechanical workflows.
Interactivity
Experience a truly interactive workspace designed for agility and responsiveness. The Geomechanics Workspace supports real-time, on-the-fly interactivity, allowing you to build and adapt complex workflows that dynamically respond to previously computed results. Whether you are adjusting parameters, incorporating new inputs, or refining your analysis, every change updates instantly — streamlining your decision-making process and keeping your workflow fluid and efficient.
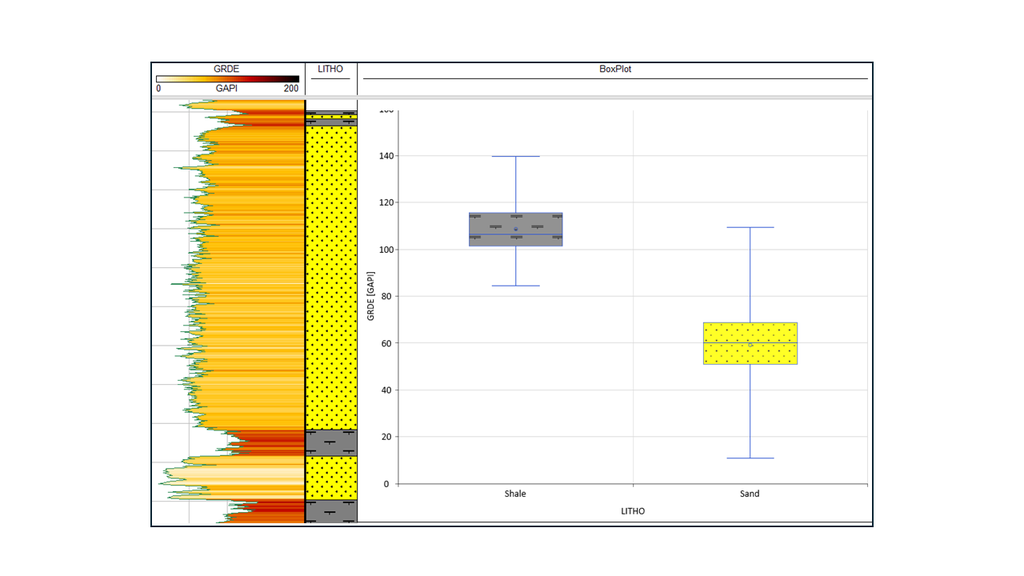
New Box Plots
WellCAD v6.0 introduces the new Box Plot functionalit y, a powerful addition to your data visualisation toolkit. This feature enables to quickly explore the distribution, variability and outliers within any selected dataset across wells, zones or lithologies. With a clear visual summary of key statistical parameters such as the median, quartiles, and extremes, the Box Plot makes it easy to identify trends, anomalies, and relationships that may be overlooked in traditional line plots or tables.
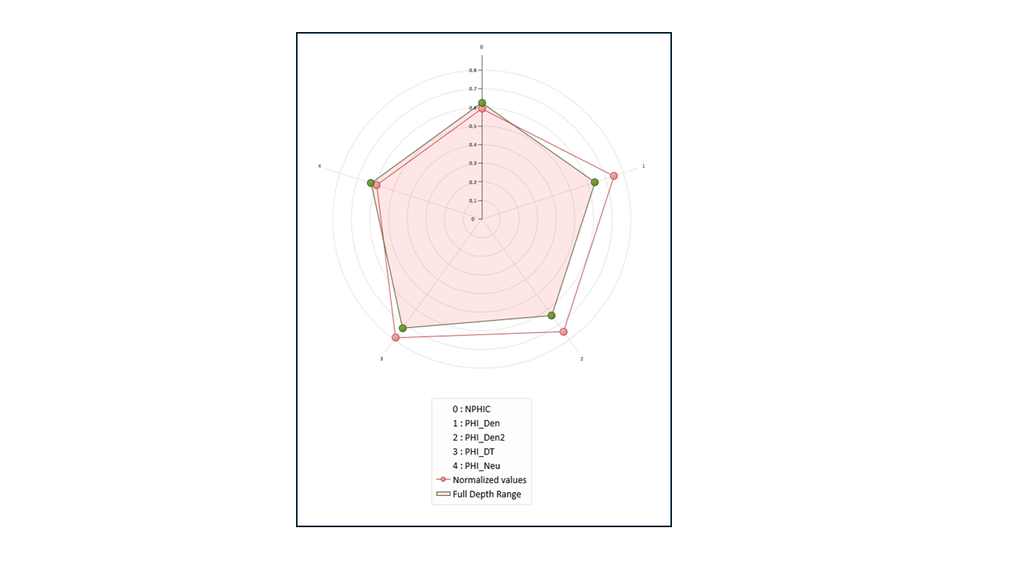
New Spider Plots
The new Spider Plot functionality is designed to provide an intuitive and comparative view of multiple parameters on a single, radial chart. Also known as radar charts, spider plots allow users to quickly assess the relative performance or behavior of different properties, such as rock mechanical parameters, log responses, or stress indicators across zones, wells or lithologies. This visual format makes it easy to identify strengths, weaknesses and outliers at a glance.
The Spider Plot supports dynamic interaction, zonation filters and cross-plotting with other views. Whether you are benchmarking formation properties or visualizing multi-parameter variability, the Spider Plot enhances your ability to communicate complex geotechnical relationships clearly and efficiently. It is a powerful tool for both technical interpretation and decision-making support.
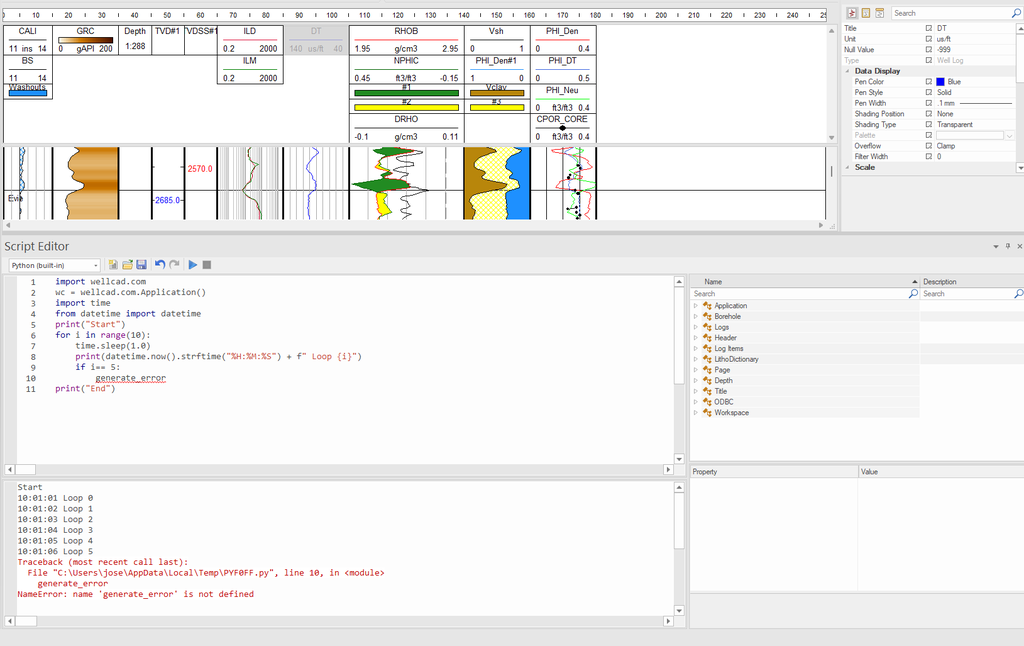
Script Console for Automation Processes
The new Execution Console in WellCAD’s Script Editor provides real-time feedback during script compilation and execution. Designed to improve transparency and debugging, the console displays compilation messages, status updates and error logs, helping users track their code performance and quickly identify issues. Whether you are running simple automation or advanced custom scripts, the Execution Console streamlines the development process with clear, actionable output.
What’s New Feature List
WellCAD Basic
- A new dialog box has been developed to let users control which types of lineations are displayed and how they appear.
- A total of seven new bedding contacts have been incorporated to the “bedding contact” list.
- “classified logs” such as grain size or interval logs can be added now to classify pie charts.
- A new “Display Dashed Lines” option has been added to the “Data Display” section of the structure log for partial pick features.
- Top depth, bottom depth, sample rate, and data count is displayed in the “Status Bar” when a single log title is selected, providing quick access without opening the “Editor” or waiting for the “Log Summary Bar” to load.
- Enhanced control over the import of text files. Columns in the dialog window can now be displayed with a wider section and a slide bar has been added.
- Image bitmap ratio is now preserved when added in annotations.
- Strata logs can now be represented with a code or a name.
- The “logs slice at” functionality has been improved to focus on a desired depth/time.
- Edits performed in litho and structure logs are now recognised and visualisation is immediately enabled.
- Significant enhancements have been made to the layout engine, which manages the positioning of log tracks, as well as to the “snap grid” functionality for improved alignment and precision.
- A new data member was added to the page setup to dynamically link log intervals with depth ranges automatically updating or removing them based on log or interval changes and to ensure depth ranges adjust in sync with section boundaries during updates.
Header Editor
- Metadata can now be dragged and dropped from the “metadata bar” to the header view in the header editor.
- New boxplots and spider plots can also be displayed in header views.
- Added depth control for charts displays.
ISI (Image and Structure Interpretations)
- Grouping of fracture types in ternary diagrams is enabled. Users can now represent and compare multiple fracture populations—each as a distinct dot with customizable name, color, and type selection—for more effective fracture network analysis.
- A process to calculate the length of the partial sinusoid divided by the length of the total sinusoid (=1 for full picks) for each fracture has been added.
- The option to display nodes “y/n” is extended to ISI workspace.
- Downward gestures to give more amplitude to flat sinusoids are now enabled.
- A new feature allowing users to filter specific fracture attributes (e.g., bedding) from the nodes display in the fracture topology view, using a dedicated dialog box, enhancing visual clarity and offering control over which attributes contribute to the node visualisation, and potentially to distribution calculations.
- Structure Log properties to toggle the visibility of dashed lines for partial picks, allowing users to hide the non-observed portions of sinusoids for clearer visualisation and easier editing, especially when working with dense or complex structural data. This should also apply to final log prints.
CoreCAD
- A mirror image option in CoreCAD has been added to allow users to flip core photos directly.
Bug fixes
- Spontaneous collapsing of items in the Explorer has been resolved.
- Blank spaces related to “engineering logs” (well completion diagrams) have been fixed.
- Resolved issues where importing LAS files as a Well Log resulted in incorrect values; the import now behaves consistently with the correct results previously observed when imported as a Mud Log.
- The issue with importing large numbers of files via File > Import into Current Document > Multiple Files > Selected Files, where the import process defaulted to single file mode and became unresponsive when canceled, has now been resolved.
- The case causing WellCAD v5.8.844 to crash, when merging two waveform logs with the Wave display open has been fixed.
- Incorrect depths for Apparent-to-True (AtT) corrected partial picks in ISI has been resolved; applying the AtT process now yields correct depths consistently, including from the ISI module.
- The situation where hidden logs could not be dragged from the Explorer Bar’s borehole document section to the borehole view has been resolved; the operation now correctly makes the log visible and positions it at the drop location, as in version 5.8.
- Depth units in the import dialog box were always displayed in meters, regardless of the units specified in the file. This issue has now been resolved.
- The problem where the Interval Statistics process from the Common menu generated only one Interval Log for quartiles has been resolved; the process now correctly outputs three Interval Logs, one for each quartile (Q1, Q2, and Q3).