
The video introduces the ISI (Image and Structure Interpretation) module in WellCAD and walks through its key features and workflow. It demonstrates how to start a new ISI workspace, select the log to work on, and input necessary data like caliper values. The module supports various image logs including optical, acoustic, and micro resistivity. It also offers functionalities for dip calculations, borehole deviation corrections, and magnetic-to-geographic north adjustments. The tutorial emphasizes ease of visualization and navigation within the ISI workspace, helping users effectively analyze and interpret structural features in borehole images.
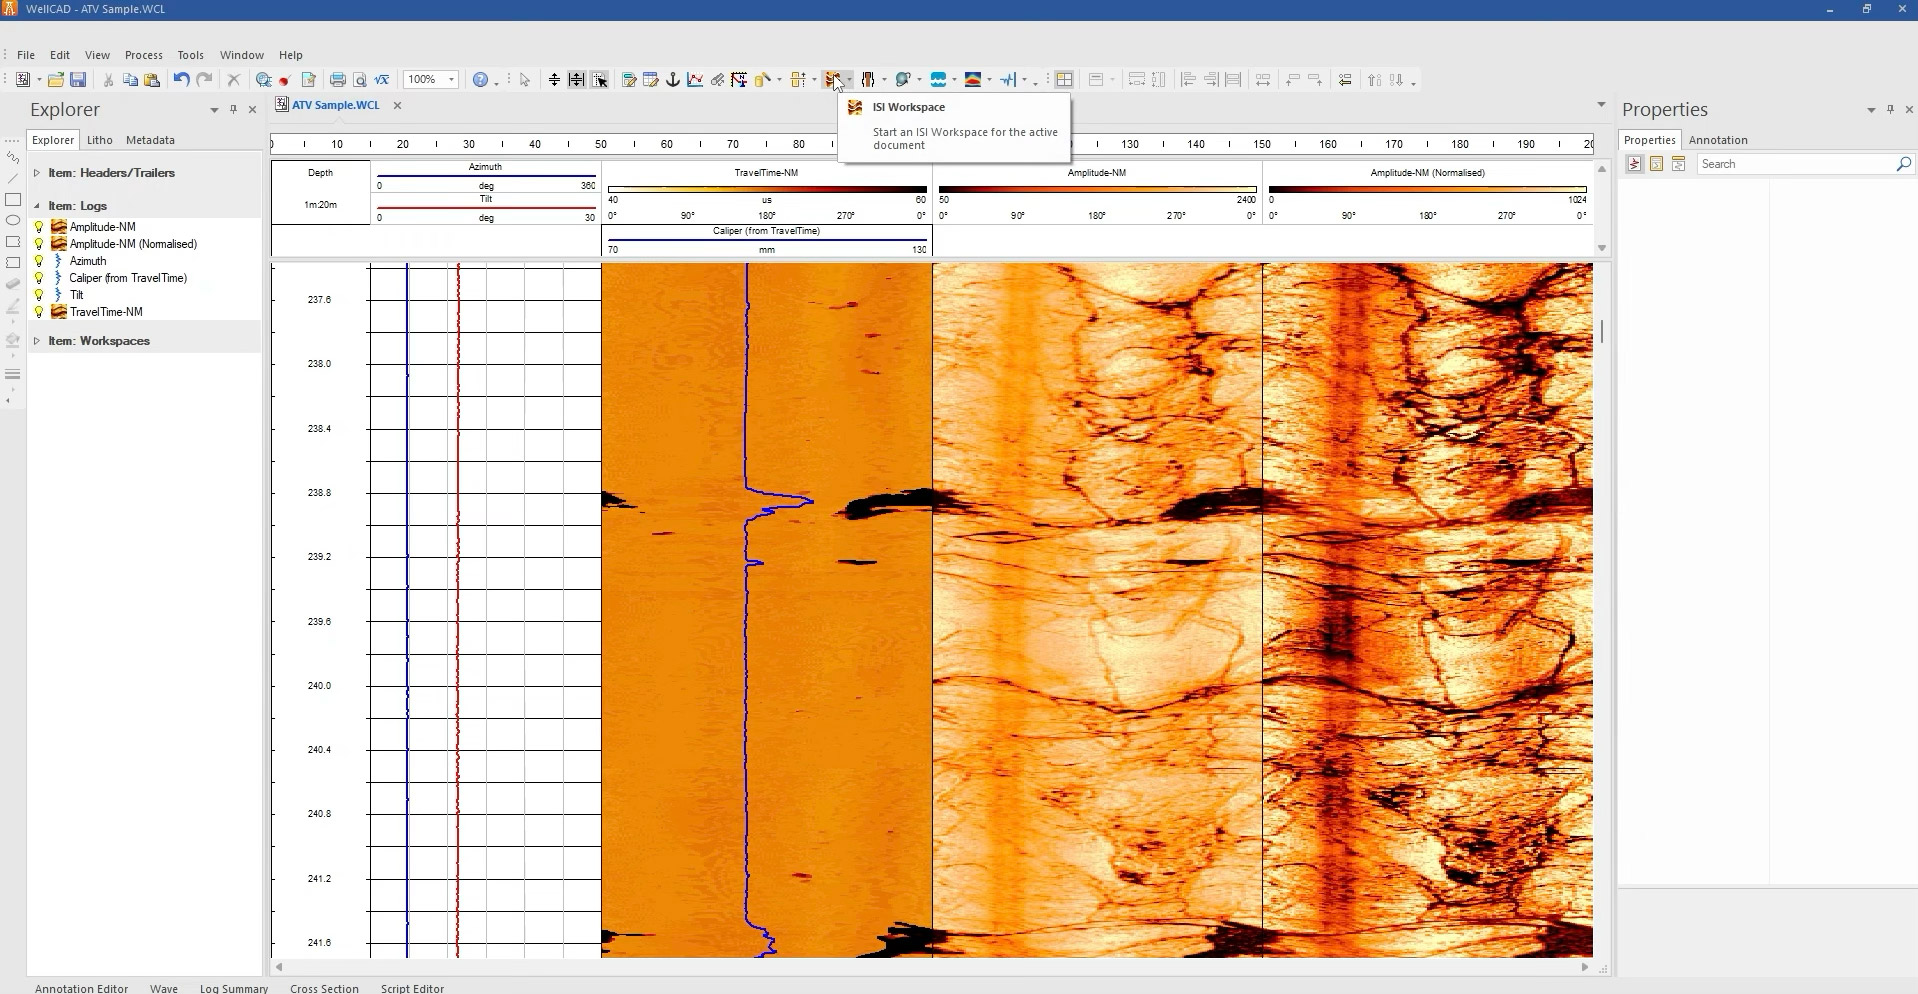
1 – Launch the ISI Module
Click on the ISI button in the toolbar to open the Image and Structure Interpretation workspace.
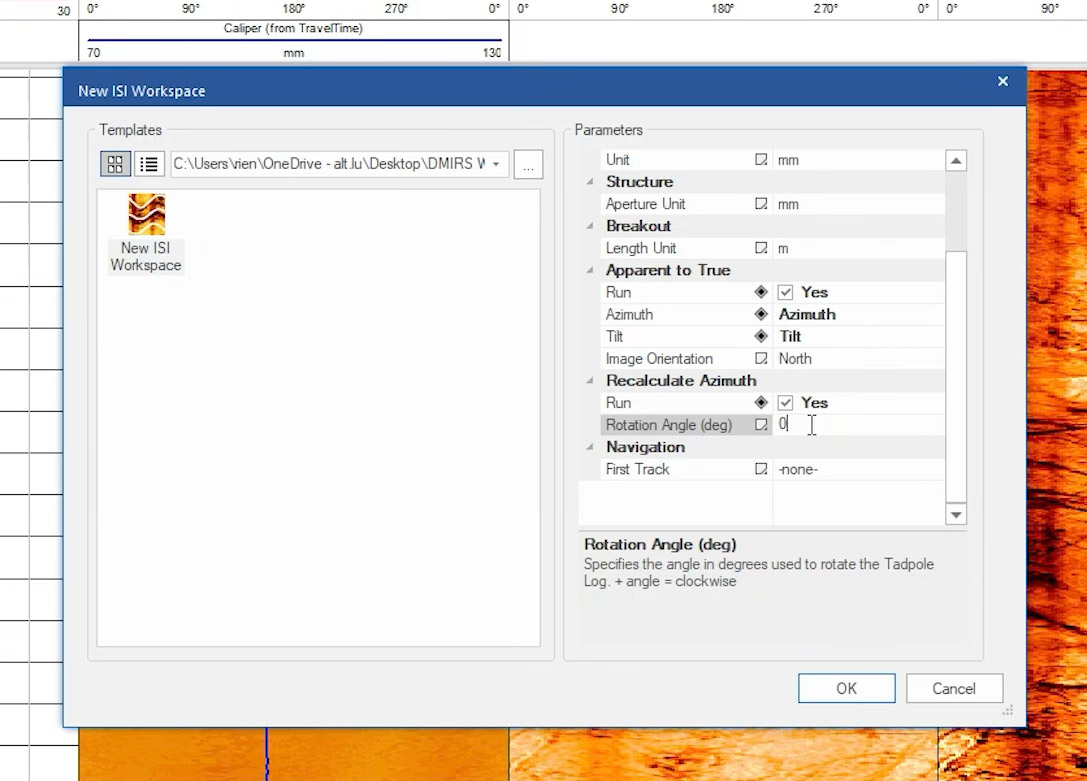
2 – Create a New Workspace (The configuration process)
- Click the ISI button in the toolbar to open the ISI workspace.
- Choose the image log to work on (e.g., from the app tutorial).
- Supported log types: Optical image logs, Acoustic logs, and Micro resistivity logs.
- Input caliper data:
- As a fixed bit size, or
- Use dynamic caliper logs.
- Units can be set to millimeters or inches.
- For micro resistivity logs, specify the depth of investigation.
- ISI can convert apparent dip to true dip by factoring in borehole deviation.
- Uses azimuth and tilt/inclination logs.
- Optionally adjust dip orientation from magnetic north to geographic north using a known rotation angle.
3 – Workspace Navigation & Visualization
- The navigation bar on the left provides an overview.
- You can zoom in/out (e.g., 1:500 for overview, 1:100 for detail).
- Display an image complexity map as a visual aid.
- Define zonations within the borehole for segment-by-segment interpretation.
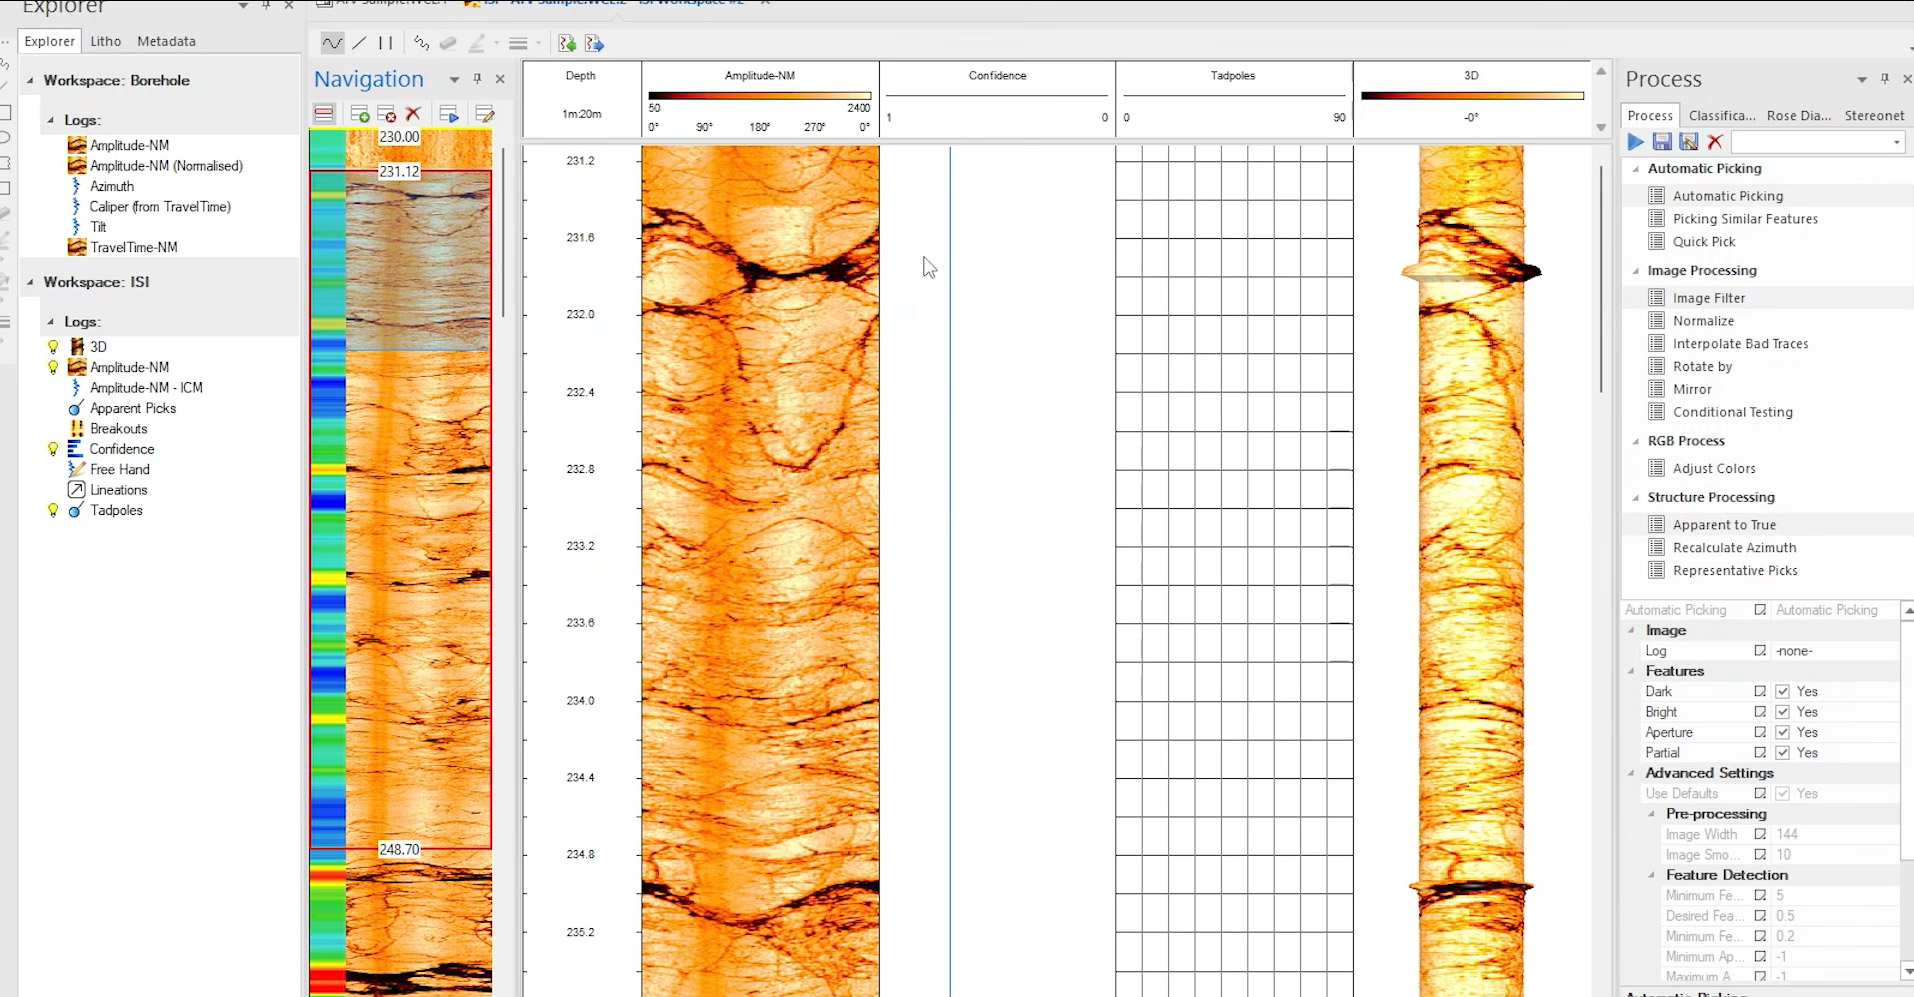
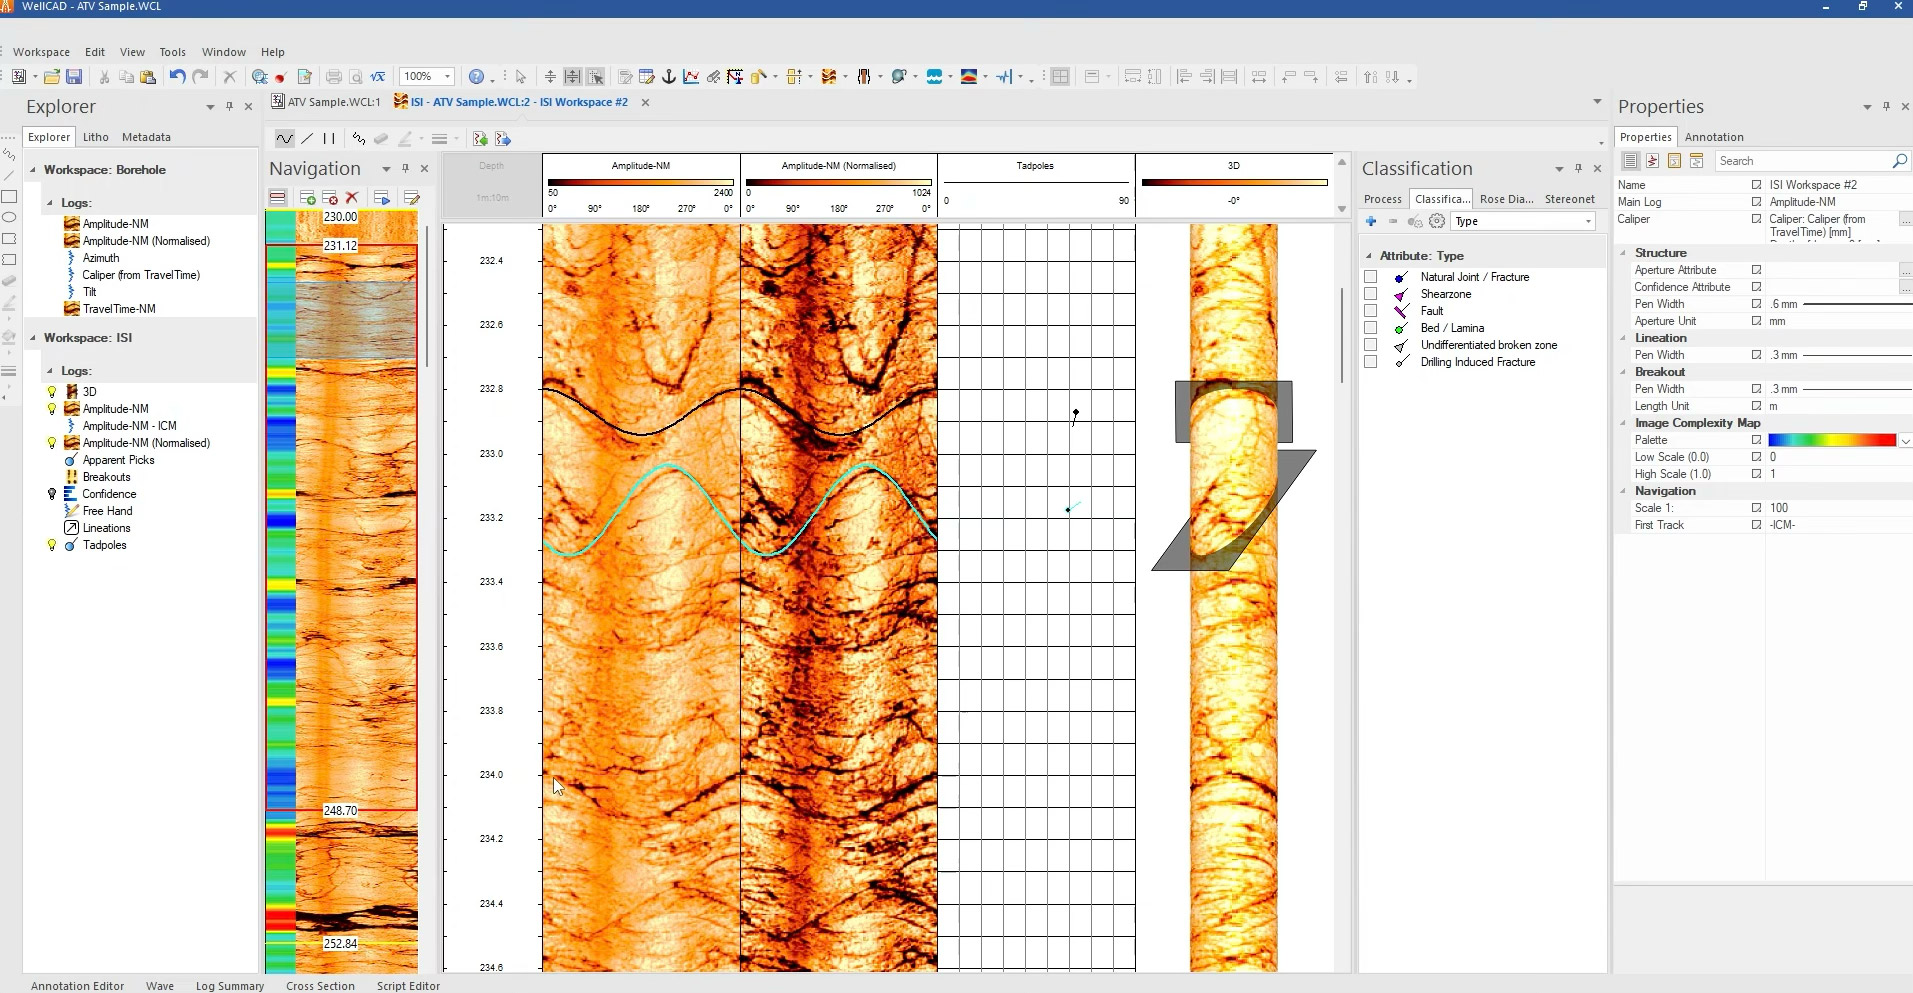
4 – Preparing for Structural Picking
- Hide unnecessary data (e.g., confidence level, if not auto-picking).
- Drag relevant logs (e.g., normalized amplitude) from the main document into the ISI workspace.
- Arrange image and amplitude logs side-by-side for better visibility.
- Open the Classification tab under “Process”.
- Click “+” to add a classification schema.
- Options include:
- Default schemas like “Fracture Ranking”
- Custom-built dictionaries
- Choose classification behaviour:
- Last used, unclassified, or a specific default (e.g., natural joints)
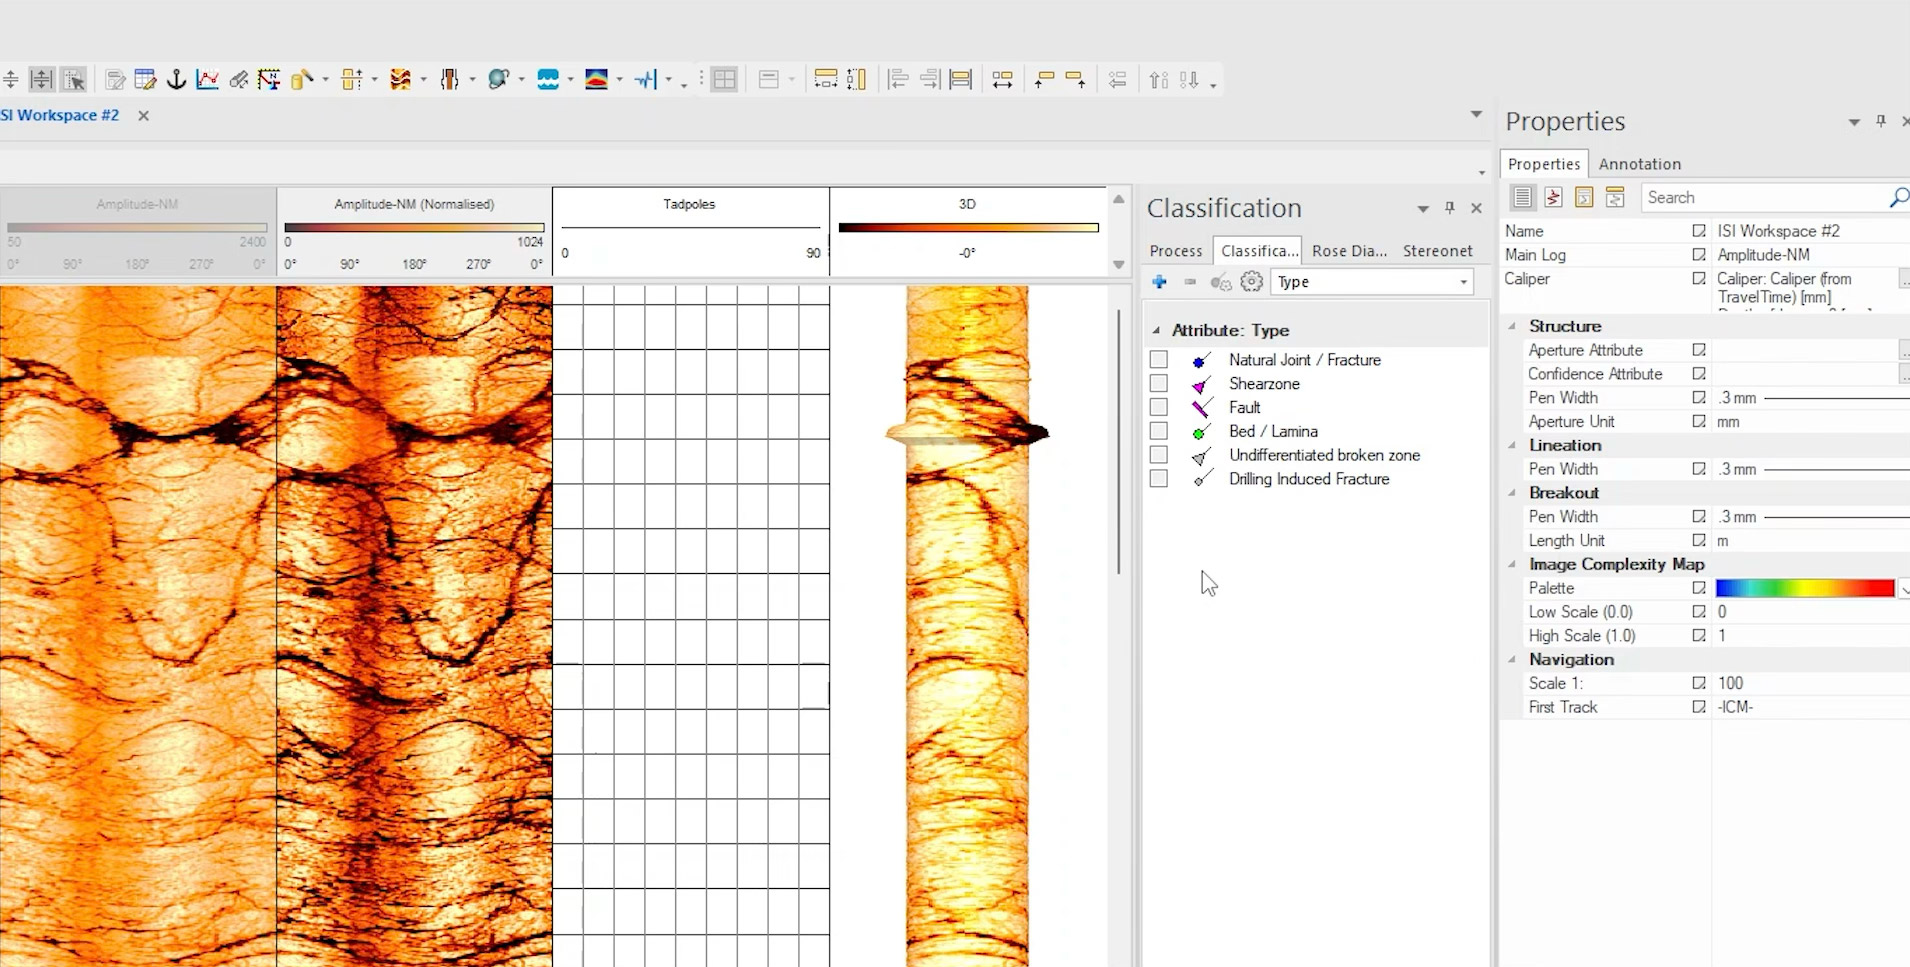
5 – Manual Structure Picking and assigning classifications
- Hold Shift + Click to start a pick (align sinusoids).
- If the pick isn’t right, hold Ctrl + Click to delete and redo it.
- Adjust pick visibility (e.g., pen width) via Properties.
- Select a pick (highlighted in blue), then apply a classification via the “Attribute” dropdown.
- Picks can be made on both the main image and normalized image.
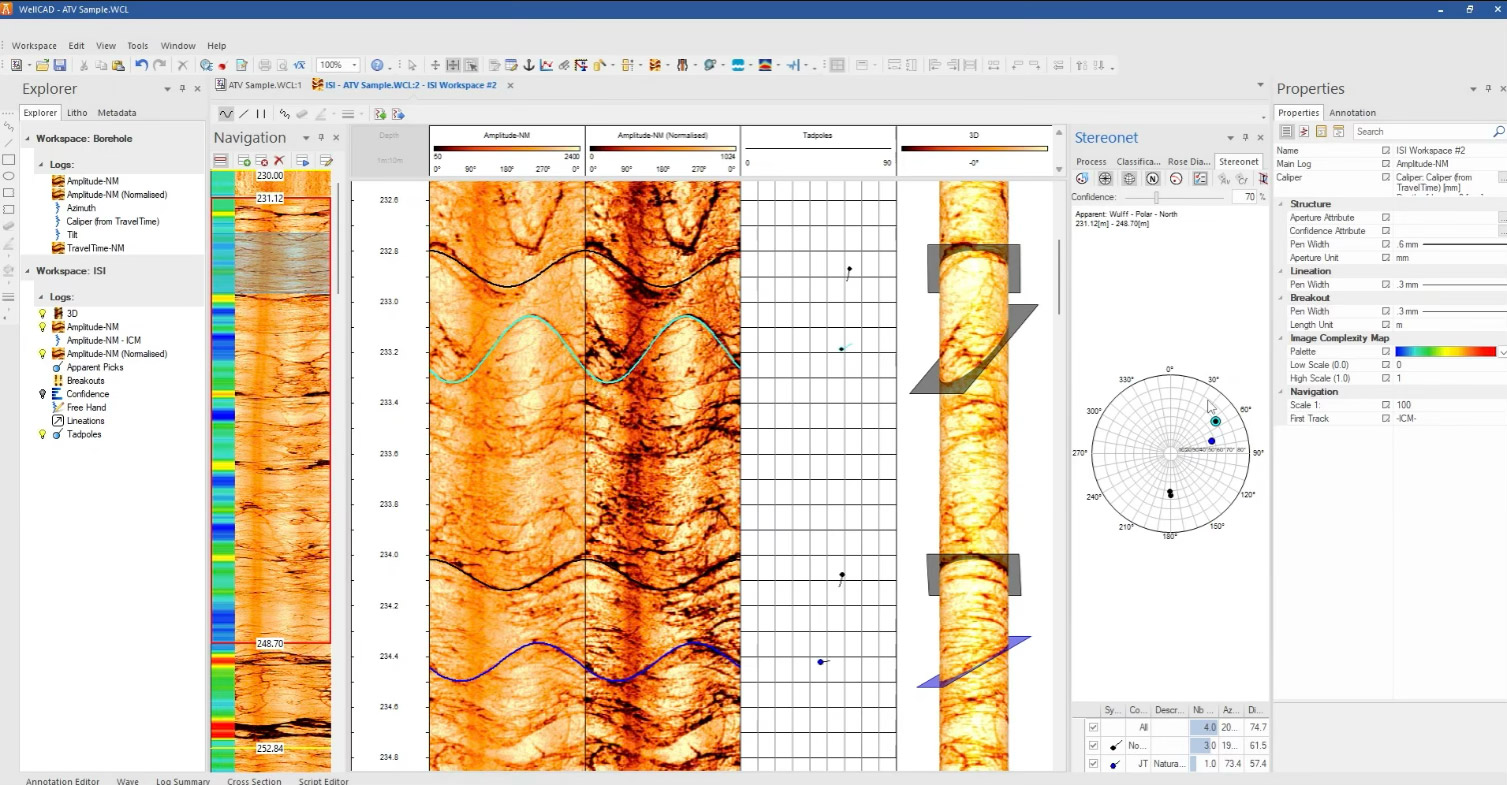
6 – Using the Stereonet
- View all picks on a stereonet, color-coded by classification.
- Tools available:
- Assign classification by selecting points on the stereonet.
- Display pole, dip, or true dip values.
- Choose between Schmidt Net or Wulff Net, Northern/Southern Hemisphere, and grid styles (polar/equatorial).
- Enable great circles if needed.
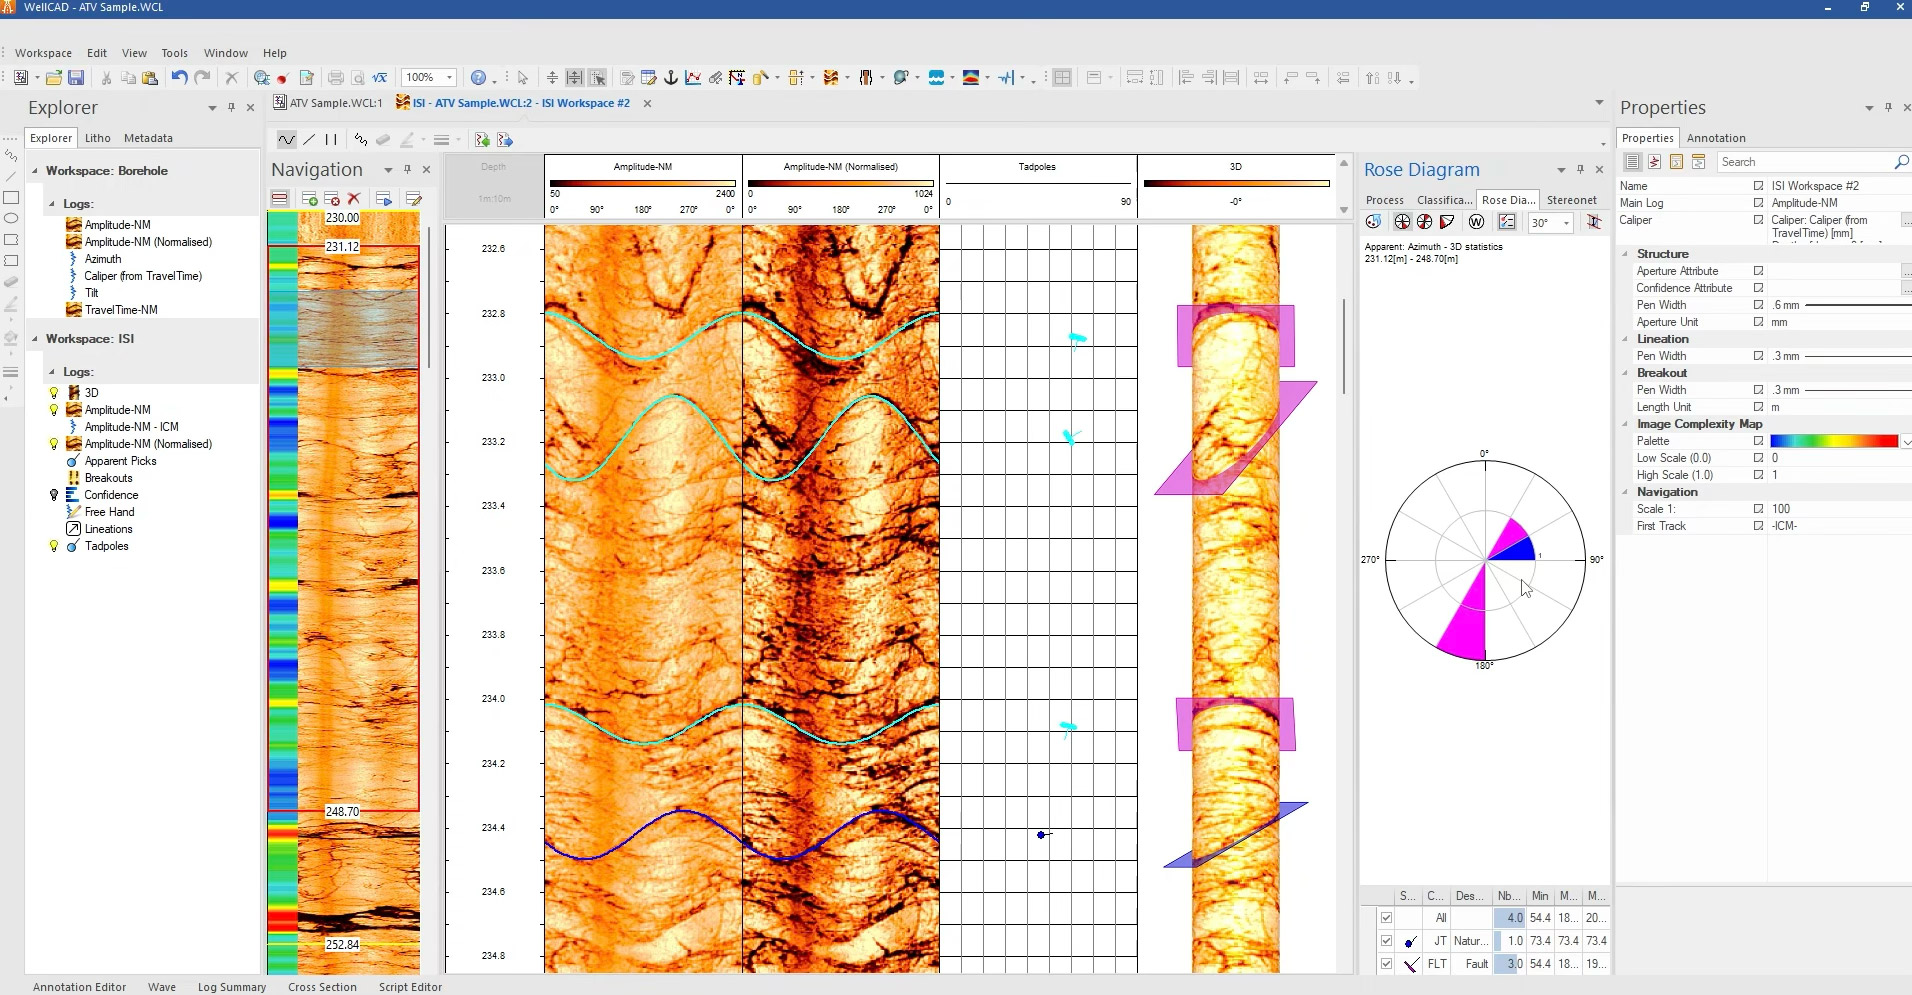
7 – Rose Diagrams
- A rose diagram provides a circular histogram of azimuth distributions.
- This is particularly helpful for identifying:
- Dominant structural orientations
- Fracture sets
- Anisotropies in the rock fabric
The rose diagram adds statistical context to visual stereonet observations and can support decisions on stress direction, fracture permeability, or structural controls.
8 – Multi-Scale Structural Interpretation
- The ISI workspace allows you to zoom in/out across scales, from detailed views to full borehole overviews.
- Structural analysis can be performed:
- On individual features
- Within user-defined zones
- Across the entire logged interval
9 – 3D log
- A cylindrical view of the borehole wall with all interpreted structures mapped around it.
- Each picked structure (e.g., fracture, fault, joint) appears as a plane or line in 3D, wrapped around the borehole geometry.
- Sinusoids drawn during picking are represented as their corresponding true structural orientations in 3D space.
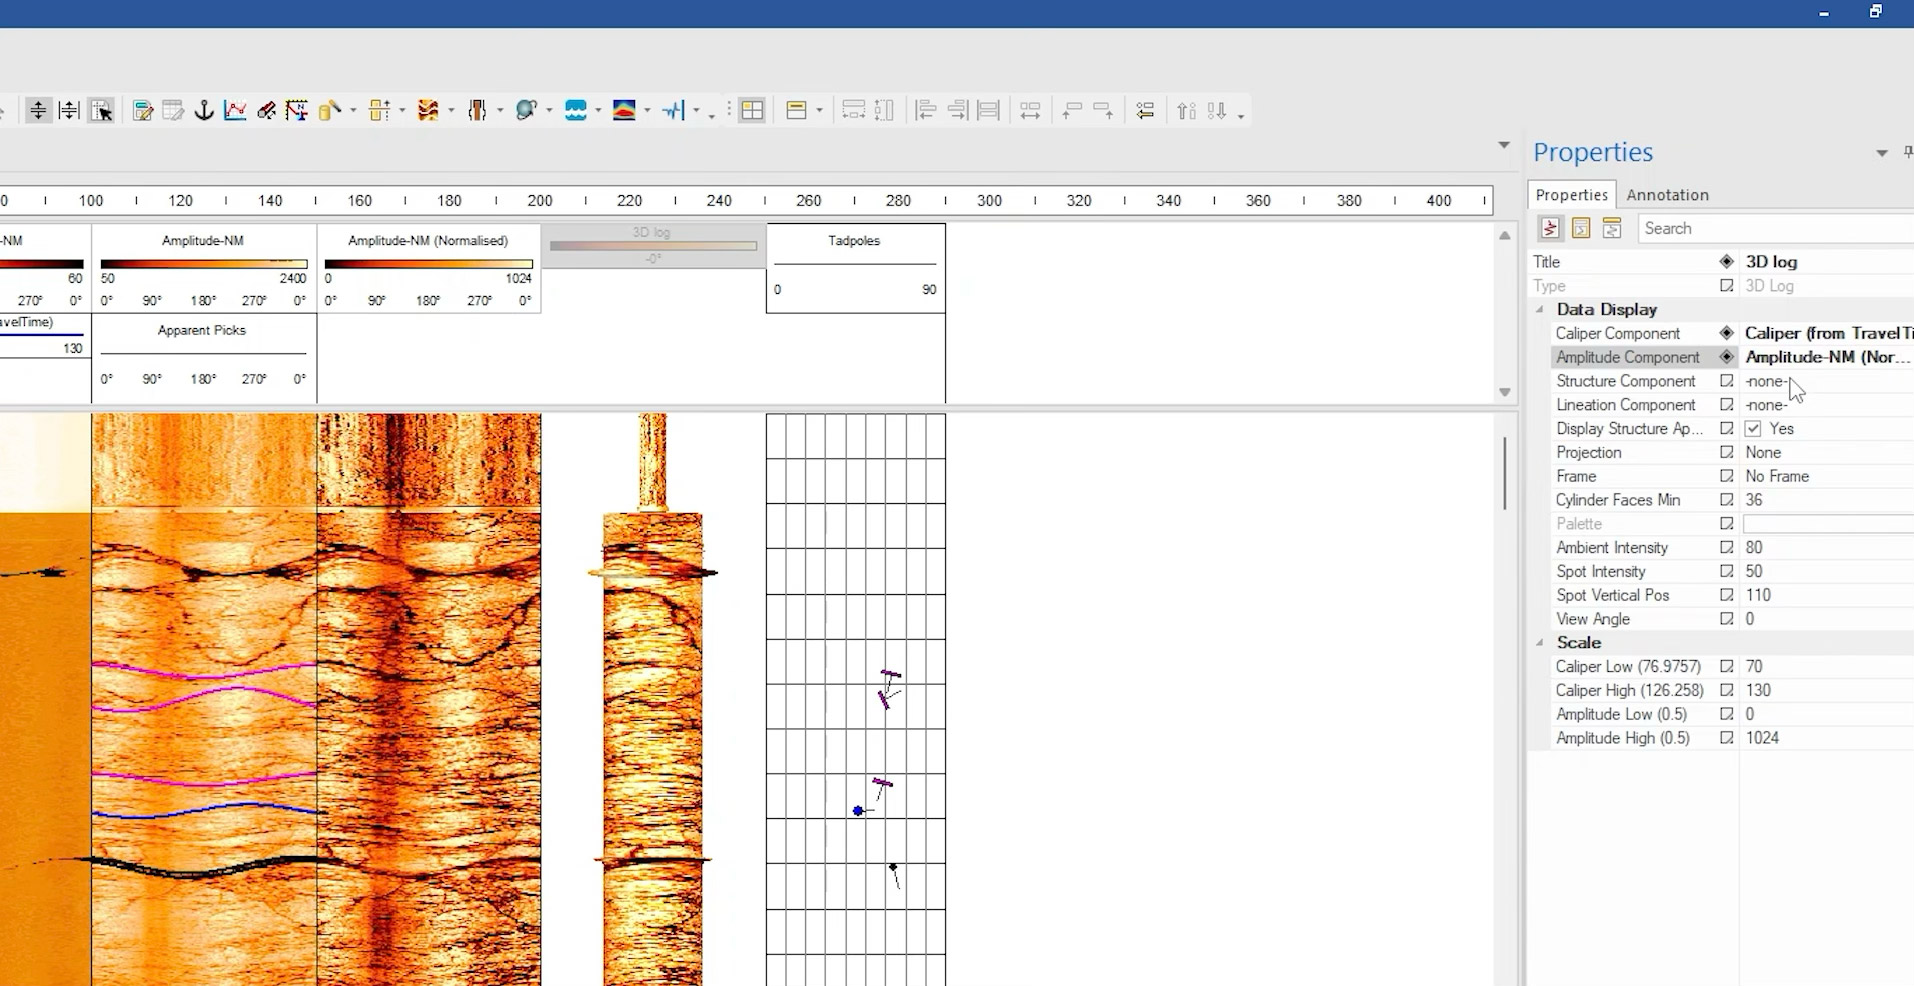
These tools work together to make ISI not just a picking interface, but a complete interpretation environment for borehole image analysis. They are designed to offer both precision in individual picks and holistic views of structural trends, crucial for geological modelling, reservoir characterization, and subsurface risk analysis.